Contents
 Welcome
 Getting Started
    System Requirements
    Cycling Equipment Requirements
    Training Knowledge Requirements
    Registration
    Creating Power Zones/Interval Specifications
    Creating Heart Rate Zones
    Training Load Settings
    Logging In
    Interval Detection & Selection Overview
 Rides
    Uploading A Ride
       Handling Missing Seconds
       Wahoo Cloud Sync
       Garmin Connect Sync
       Ride Backfill Request Utility
       Ride Load Status Checker
    Adding A Manual Ride
    Finding Rides
    Deleting Rides
    Exporting Rides
    Ride Feed
    Ride Calendar
    The Ride Page
       Ride Header
       Map
       Ride Graph
       Intervals
       Heart Rate Zone Distribution
       Power Zone Distribution
       Cadence Distribution
       Power Curve
       Stats
       Laps
       Training Progress
       Edit Ride
       Comments
       Zwift Workout Generator
       Workout Performance Report
    KPower
       Uploading KPower Rides
       Curating KPower Source Rides
 Reports
    Race Readiness Graph
    Power Curves
    Rider Stats Year Over Year
    Personal Records
       Personal Records Overview
       Personal Records Report
       Personal Records - Workload Correlations
    Ride Summary Charts
    Critical Power
       Overview
       Generating A CP Graph
       Critical Power History
       Critical Power History Backfill
    Fitness Signature
    Hammer Score Leaderboard
    Training Effectiveness
    Rider Assessment
    Plan Strategy
 Workouts
    Workout Builder Screen
    Adding A Workout
    Adding A Block
    Adding A Component To The Workout Graph
    Deleting A Block
    Insertion Points
    Fixing A Block Mistake
    Multi Select Blocks
       Building
       Saving As A Component
       Removing Multi Select
    Finding Workouts
    Editing Workouts
    Deleting A Workout
    Generating A Zwift Workout
    Components
    Downloading Workouts
    Workout Projections
    Scheduling A Workout
       Rescheduling A Workout
    Deleting A Workout From The Schedule
    Viewing A Workout Performance Report
    Importing A Workout
    Interval Advisor
       Saving A Recommendation
       Adaptive Workouts
    Curating Interval Advisor Source Rides
 Other Functions
    Changing General Settings
    Changing Rider Assessment Settings
    Changing Power Zones/Interval Specifications
    Changing Heart Rate Zones
    Changing Training Load Settings
    Coaches And Friends
    Viewing The Terms Of Service
    Viewing The Privacy Policy
    Logging Out
    Evaluating Progress
    Changing Advanced Settings
    Notifications
       Insights
          Critical Power AWC Check
          Training Effectiveness
          Interval Workload Levels
       Warnings
          FTP CP Mismatch Warning
    Changing Bicycle Settings
 FAQ
    General FAQ
  
Index

Home > Reports > Power Curves

Power Curves

The  Power Curves report allows you to generate 2 mean maximal power curves for comparison.  Each curve can represent an individual ride or a date range. The report also serves as an entry point to generating Critical Power graphs.

  1. From the main menu  click the {Reports} {Critical Power} {Power Curves} menu selections.
  2. The Power Curves Report page will appear.
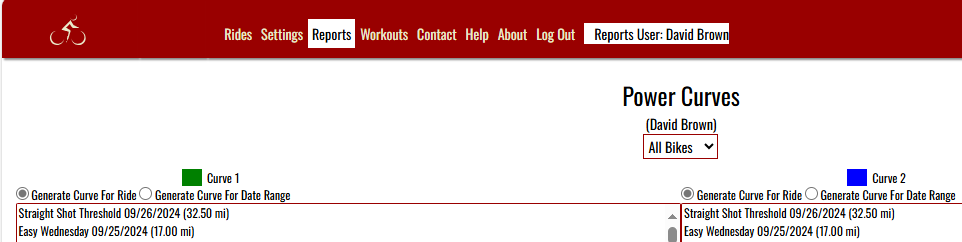
  3. Decide what you want each curve to represent, and then click either the Generate Curve For Ride or Generate Curve For Date Range radio buttons at the top of the page depending upon your choices.
  4. If you selected Generate Curves For Ride, then click on a ride from the corresponding Rides dropdown list beneath the radio button.
  5. If you selected Generate Curves For Date Range, then type in Start and End Date (or use the Calendar popup)for the range in MM/DD/YYYY format in the areas provided beneath the Rides dropdown list.  (Display the popup by clicking the Calendar button to the right of the input textbox for a date).
  6. Once you've finished your selections, click the Generate Curves button to generate the curves.
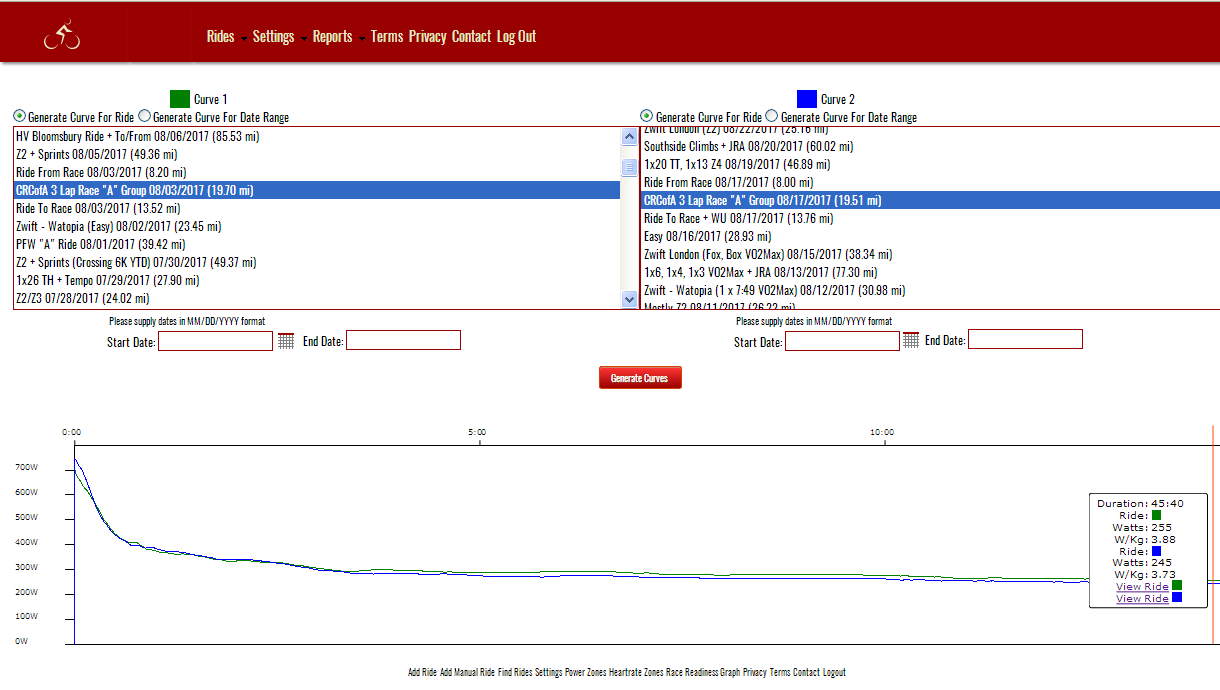
  7. The Curves will be displayed beneath the controls area.  Curve 1, representing the choices from the left hand side of the screen will appear in green, Curve 2 representing the choices from the right hand side of the screen will appear in blue.
  8. Hovering over the graph with the mouse displays an InfoBox with the Watts and Watts/Kg for the given duration, for each curve.
  9. Clicking on the graph freezes the InfoBox and allows you to click either of the links back to the effort's ride, which appear in the InfoBox.
  10. In the InfoBox, the watts for each selection are hyperlinked. Clicking on the hyperlink will cause the Watts/Duration to be selected as a Critical Power trial. The trial will appear in the Critical Power section of the screen beneath the graph.

The image below depicts a graph which compares 2 road races, run on the same course, on different days.


See also

  
HelpConsole 2007 - Standard

Copyright © 2004 - 2007 Extreme Ease Software Inc. All Rights Reserved.